Project Overview: Doctor Scrapenstein
The Objective
A fully self-initiated, end-to-end project (from ideation to production) built to empower sales teams. The tool
automates heavy data extraction from Google Maps and translates complex local SEO metrics into actionable insights,
allowing sales representatives to immediately identify and prove prospect pain points.
My background helped me a lot here, as I'm a former SEO / SEA expert and I also did alot of statistical analysis over
Google Maps performance for local dealers.
Technical Stack
- Backend Framework: Python, Flask - I wanted something fast to code with very few boilerplate.
- Data Processing: Polars - I need fast computation over big sets of datas and enforced types / schemas.
- Data Visualization: Plotly - I needed auto-sclaing graphs and interactiveness (zoom, hover, filtering)
- Infrastructure & Data Acquisition: REST APIs, using a data provider.
- Domain Expertise: Algorithmic Mathematics, Advanced Local SEO (Google Business Profiles - My former SEA / SEO
expertise was useful here)
Core System Capabilities
- Asynchronous Scraping Queue: A logistical pipeline allowing users to batch and queue large-scale scraping tasks to
run autonomously. - Autonomous Error Handling: Built-in fallback mechanisms and troubleshooting tools that allow end-users to unblock
queue issues without requiring admin intervention. - In-Depth Performance Audits: A module dedicated to pinpointing the structural strengths and weaknesses of any
given brand's local performance on Google Map. - Geospatial Clustering & Benchmarking: Dynamically assigns individual dealers to specific local market clusters,
enabling highly accurate comparisons against their direct geographical competitors. - Prescriptive R&D Algorithm: Identifies competitive gaps and automatically generates a specific task list to
improve the shop's local ranking. - Transparent Data Access: Interactive, data-dense charting paired with raw, granular data tables ensuring users can
audit the underlying data. Also I don't like non-granular data.
Documentation and ressources
- Business Cases with statistical studies integrated, to improve the salesman's impact.
- Tutorials and clear explanations about how the data are gathered, the methodology and how to understand the metrics.
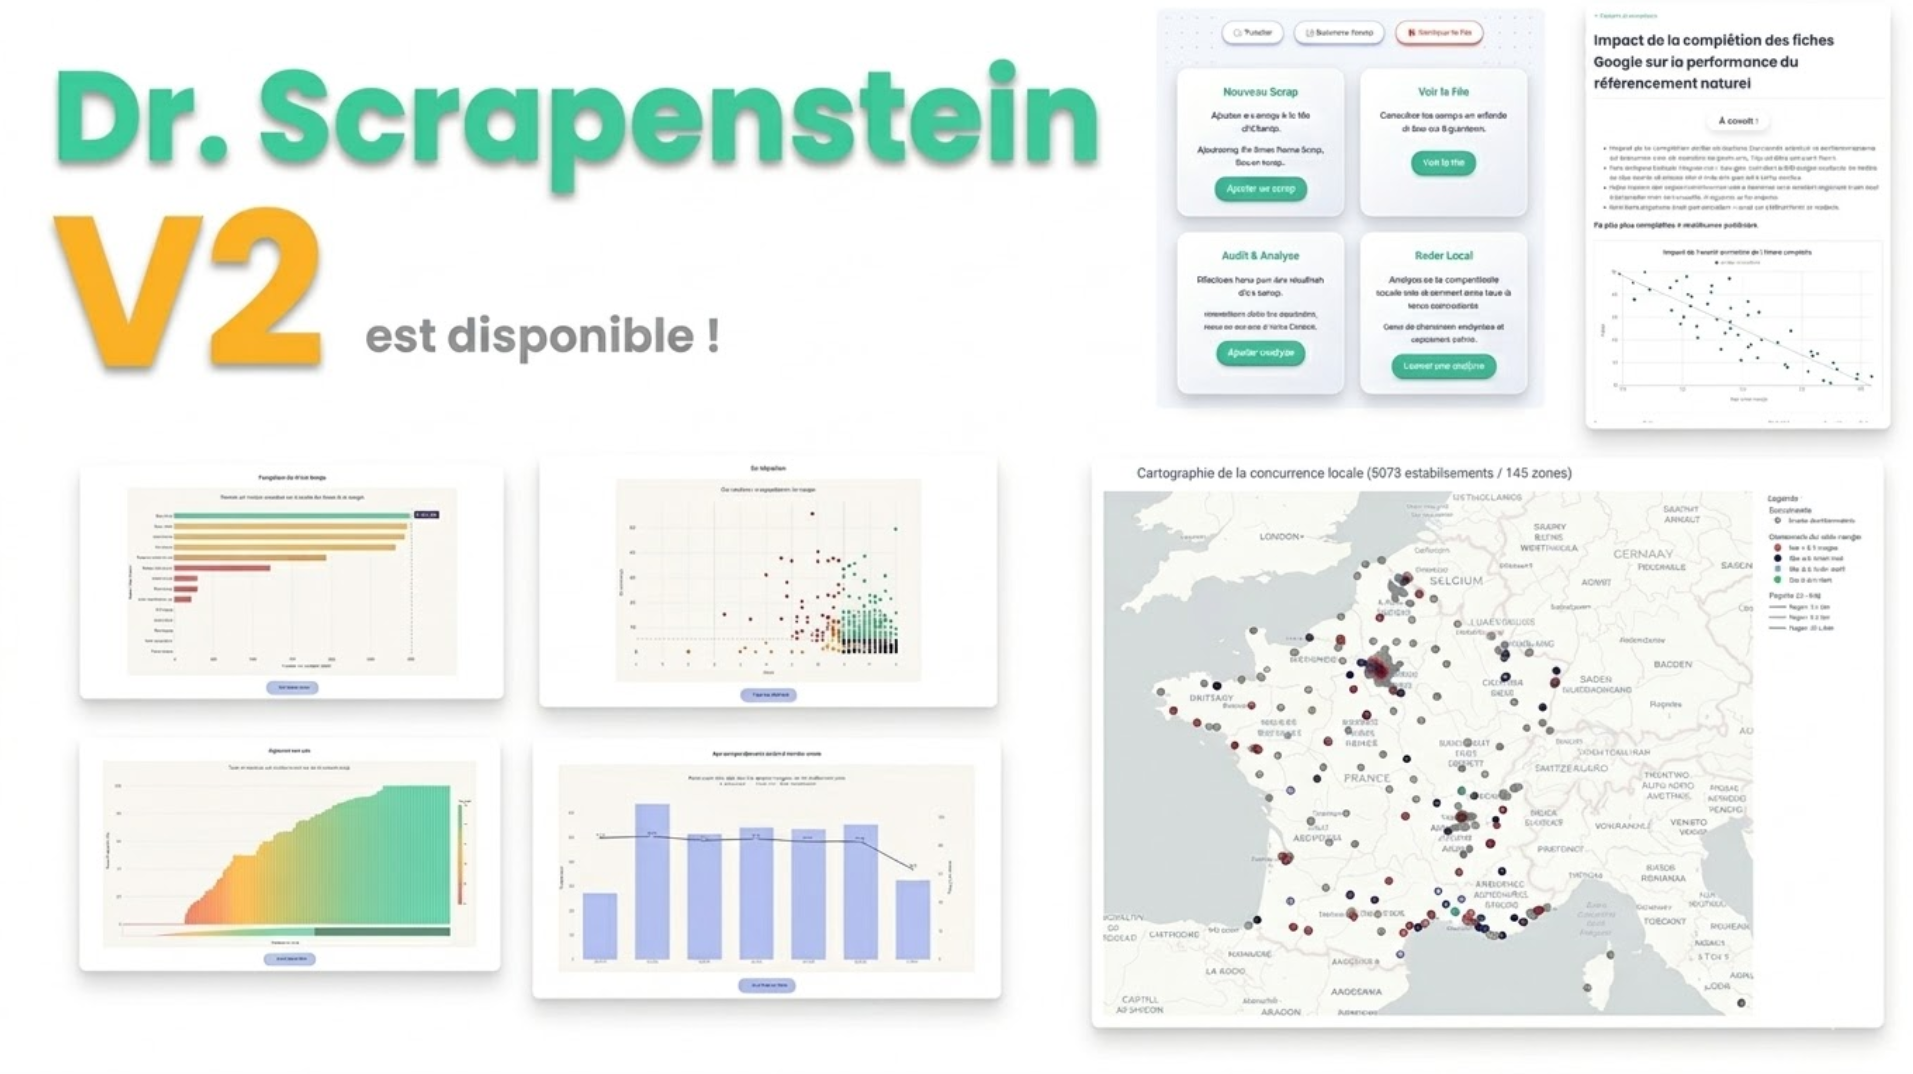
A Look Inside (Warning : it's colorful)
1. General Overview: Homepage
A clean, functional entry point. The UI/UX is purposefully minimalist, adopting the styling guidelines of the client
company to keep the focus on the data.
I wanted it to be "not too ugly" in order to be displayed directly to prospects and customers during meetings.
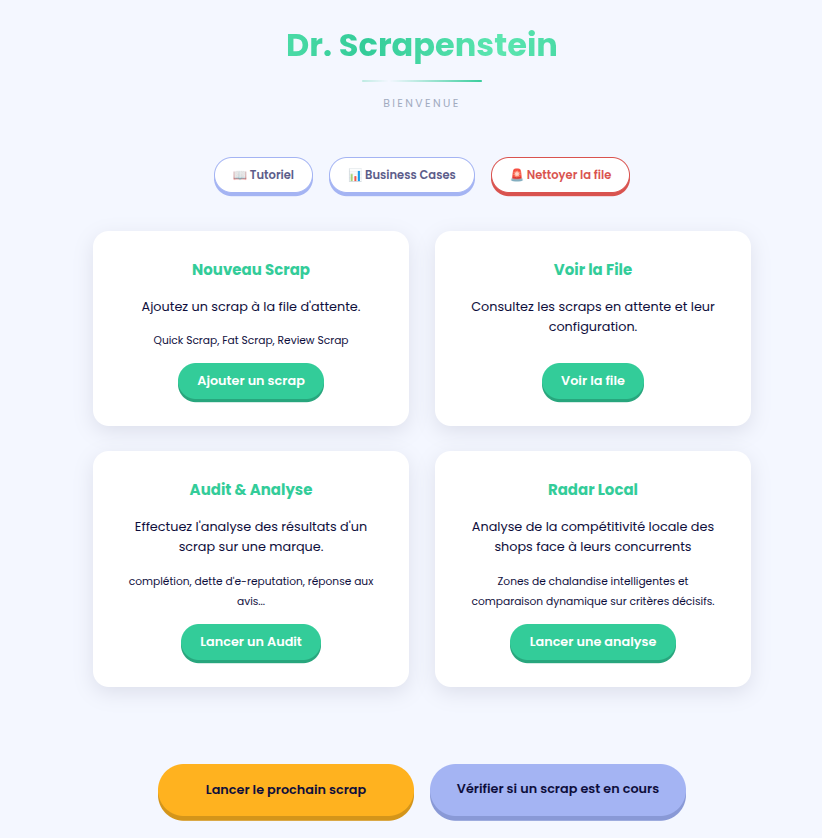
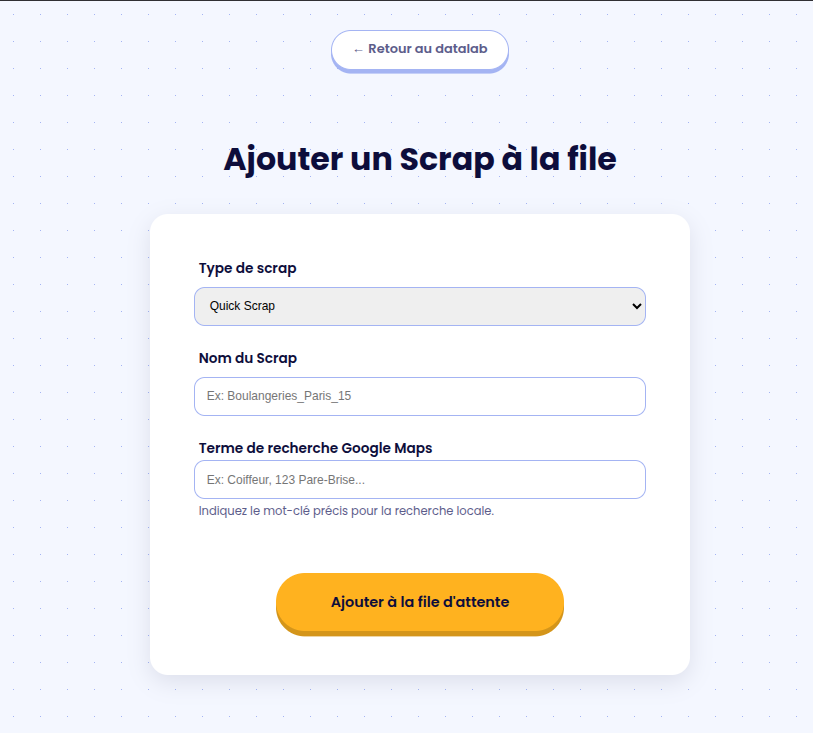
2. Adding a Scraping Task
Users can initiate data extraction by choosing from three distinct models:
- QuickScrap: Gathers data across the 40 largest cities in France for a rapid market overview.
- FatScrap: A heavy-duty version that inspects around 500 Google Maps URLs nationwide to extract deep, granular
data. - ReviewScrap: An enrichment pipeline that pulls detailed customer reviews. It needs informations from a Quick or
FatScrap to run. Hence, it's additional.
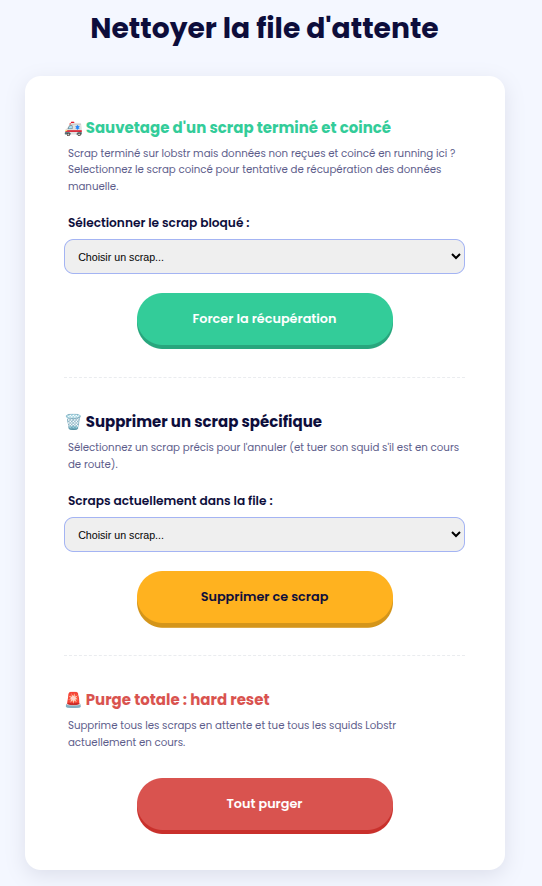
3. The Scraping Queue
Once the queue is launched, it operates autonomously: the system triggers a webhook when a scrap starts, and
automatically triggers the ETL (Extract, Transform, Load) pipeline upon data reception.
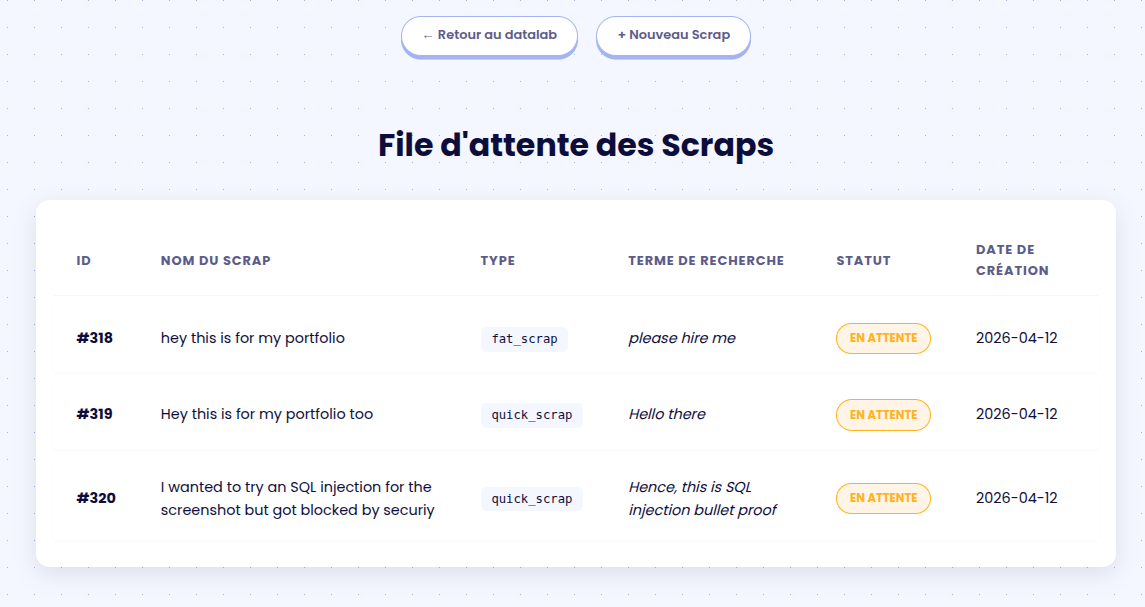
I gave the ability to the user to manage their own queue in case of problems:
- Enforce the download of a stuck scrap (in case the webhook failed, the probability is very low taking account of the
amount of workers and users, but it is not null). - Delete a specific Scrap in queue.
- Purge the whole queue (every system need a killswitch !)
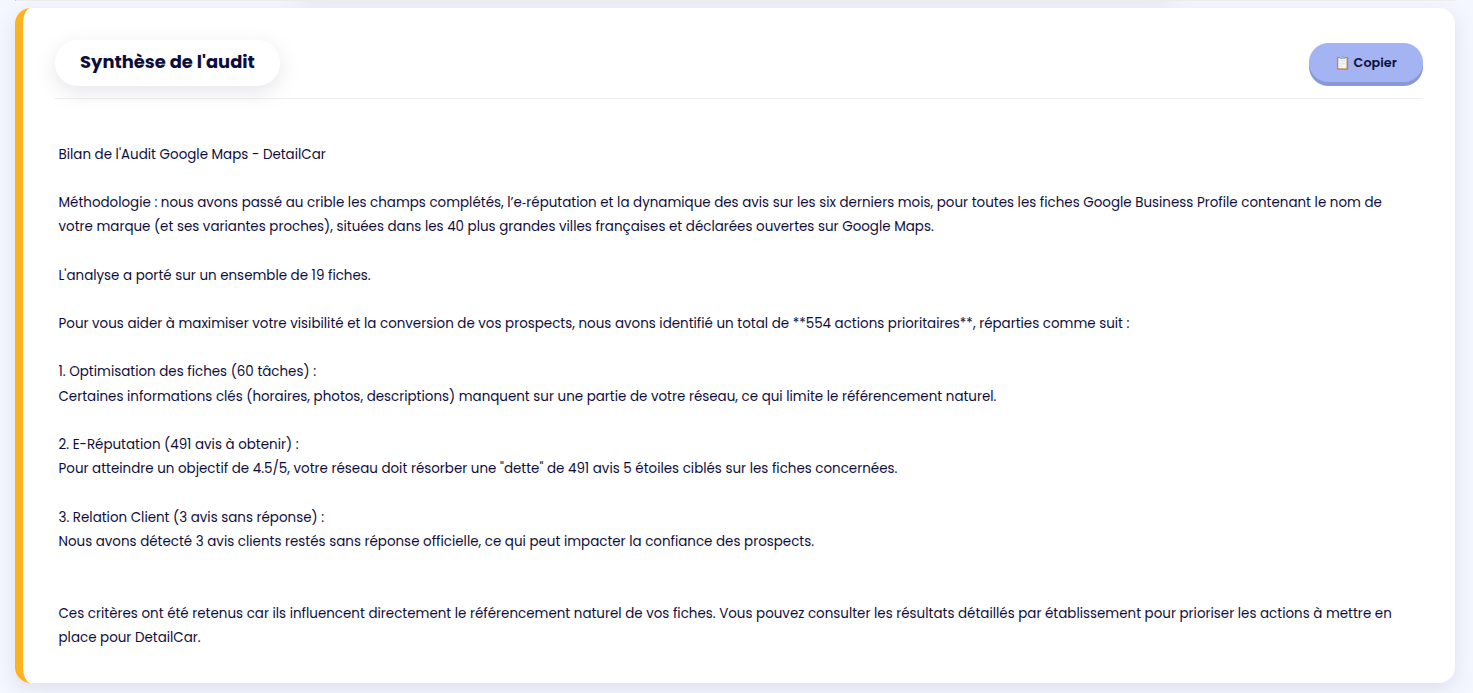
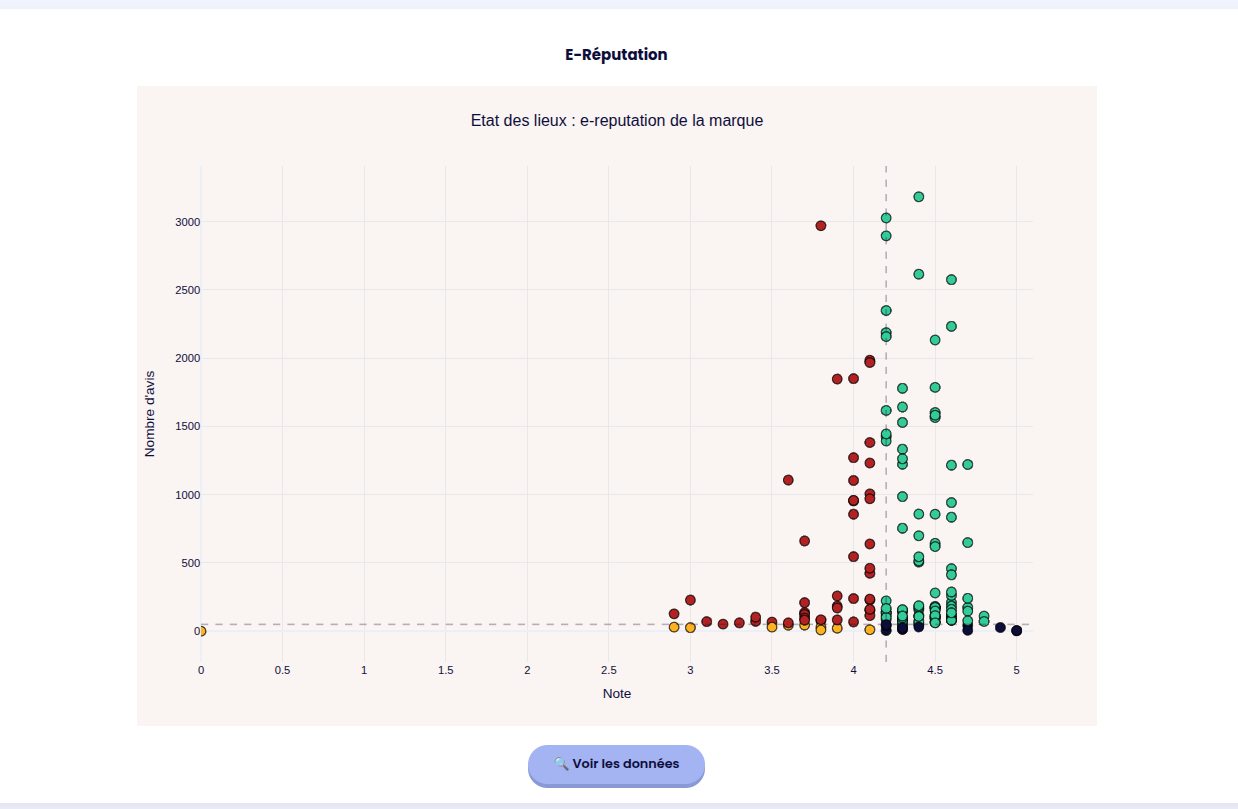
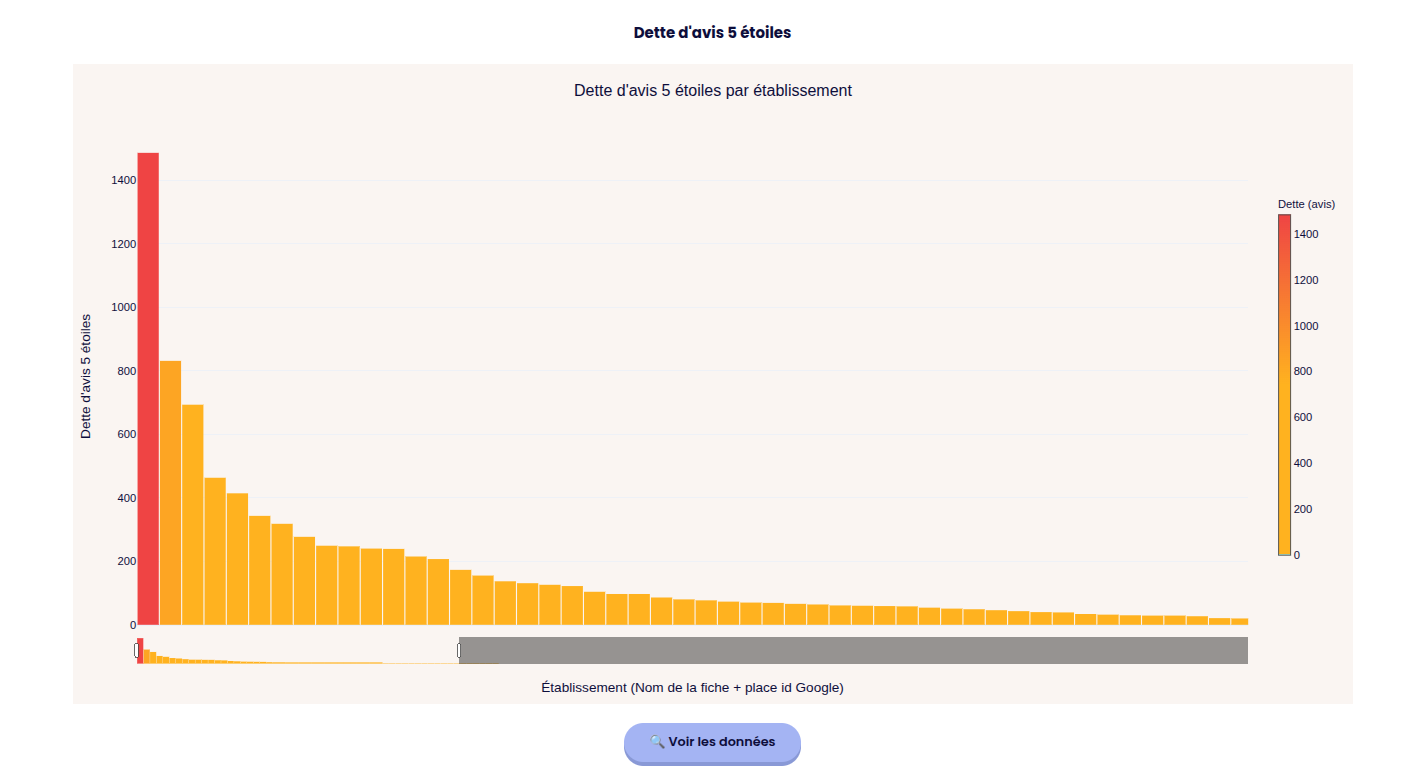
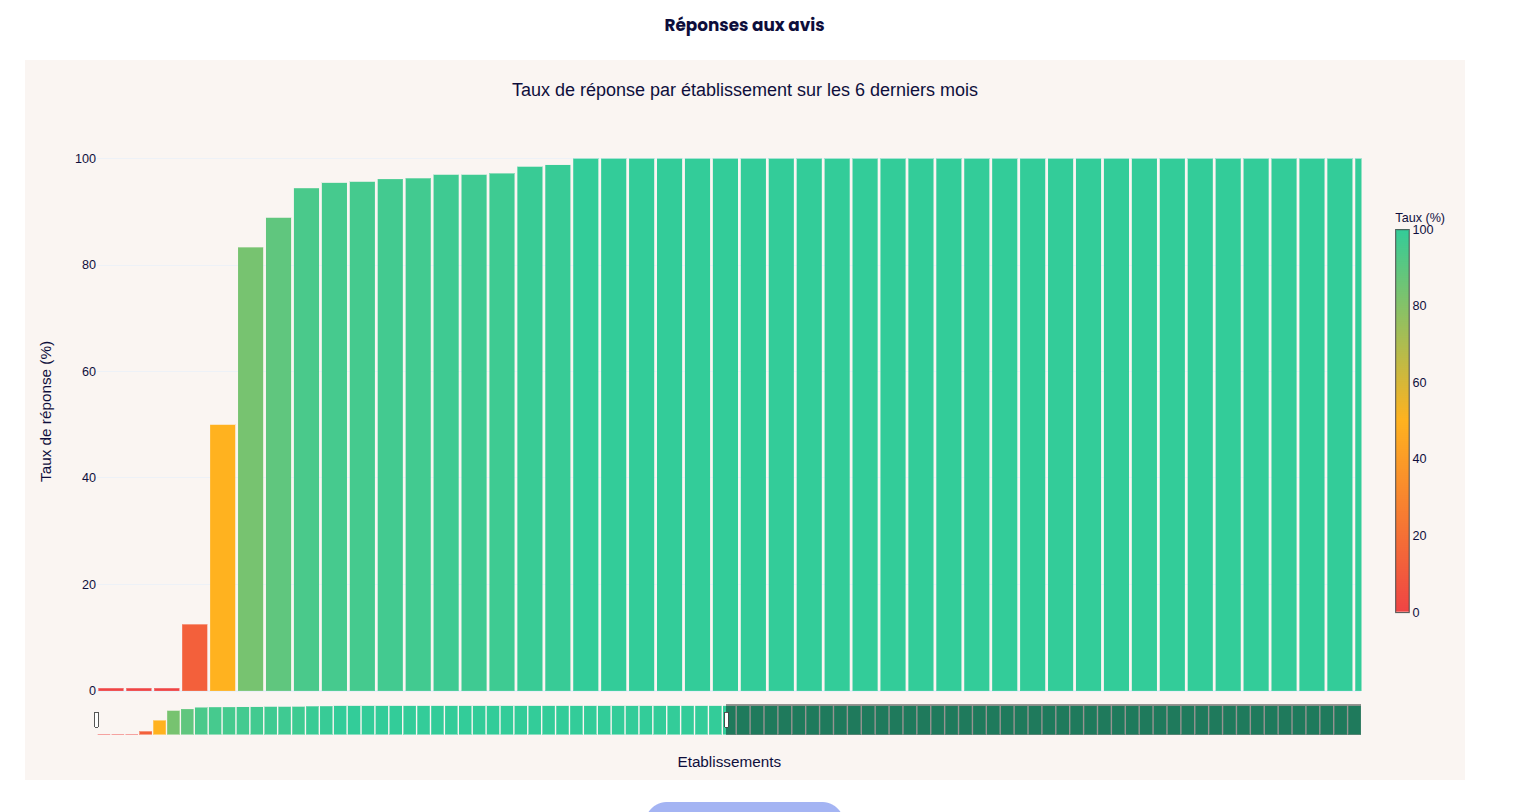
4. Brand-Level Analysis
The goal here is to pinpoint the exact metrics that negatively impact a brand's Google Maps ranking. The Plotly-powered
charts are fully interactive: users can zoom in on specific data points, with individual shop metrics revealed on hover.
The colors directly point the goods and bads.
The user can set up it's own threshold depending on the customer's objectives.
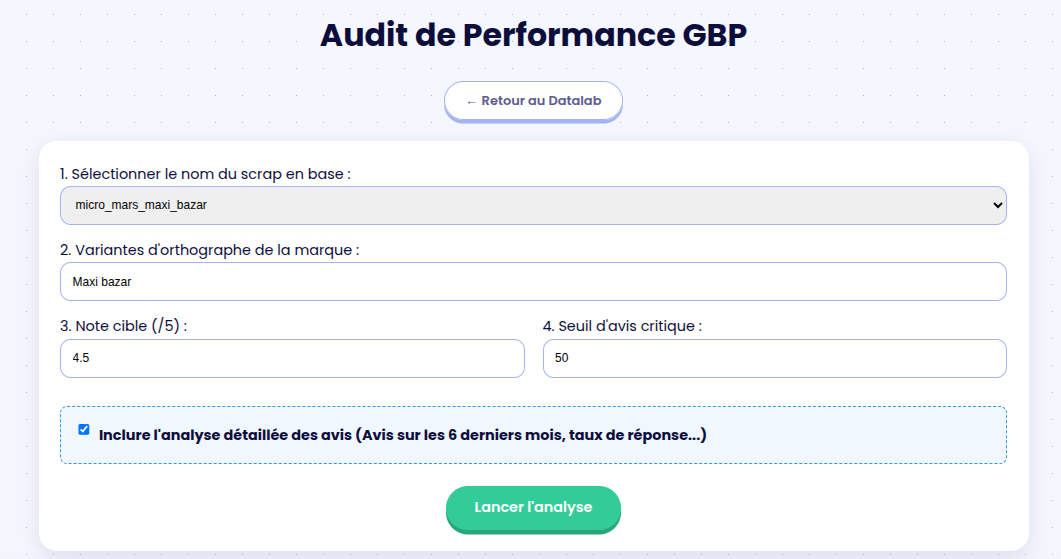
A quick dynamic summary is provided, it can be copy & pasted easily.
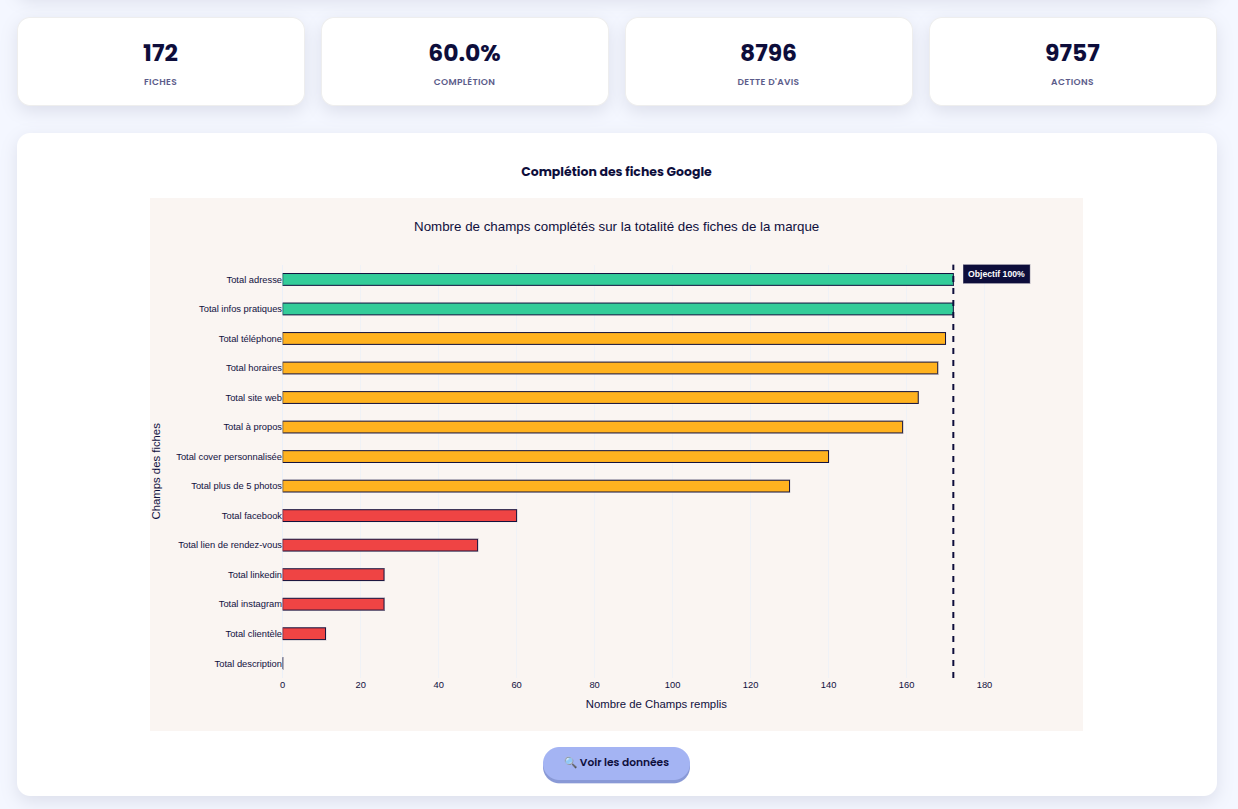
More datas are available but I think you got the idea.
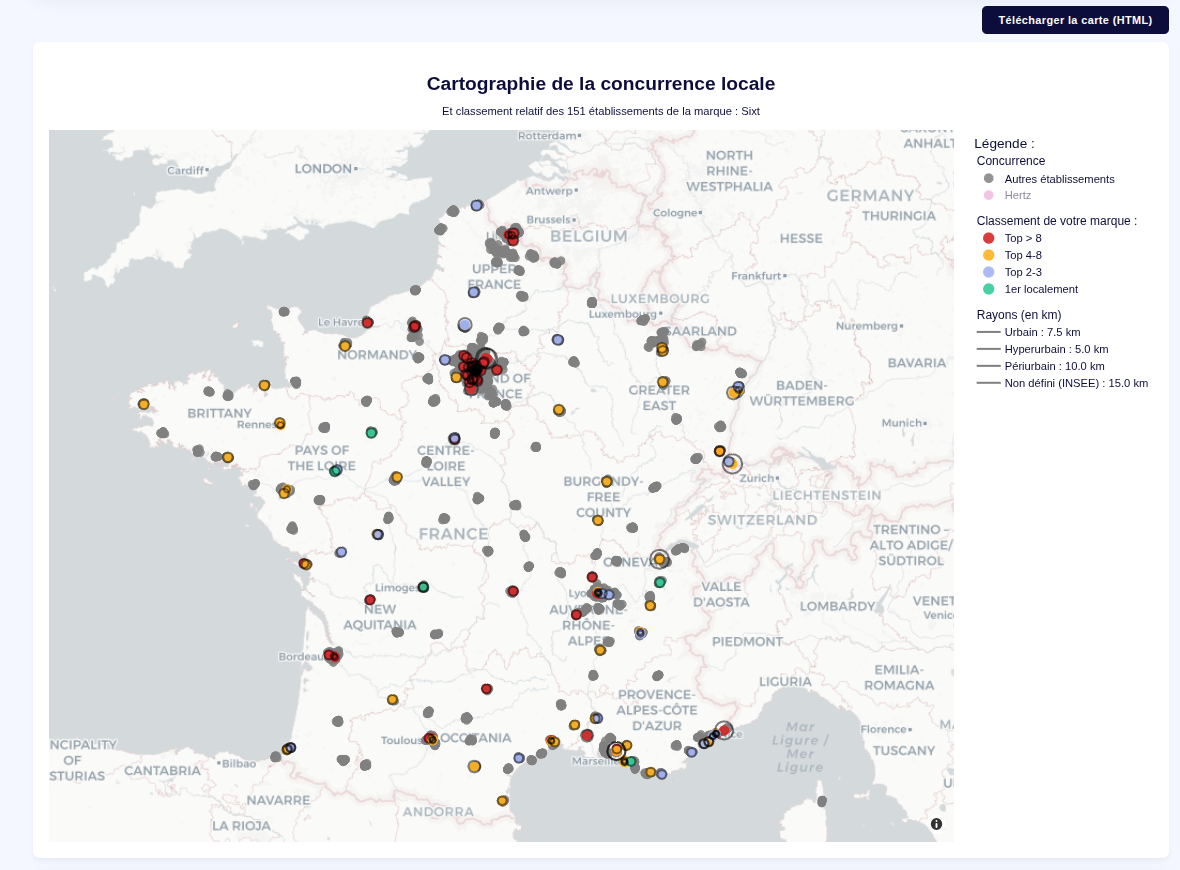
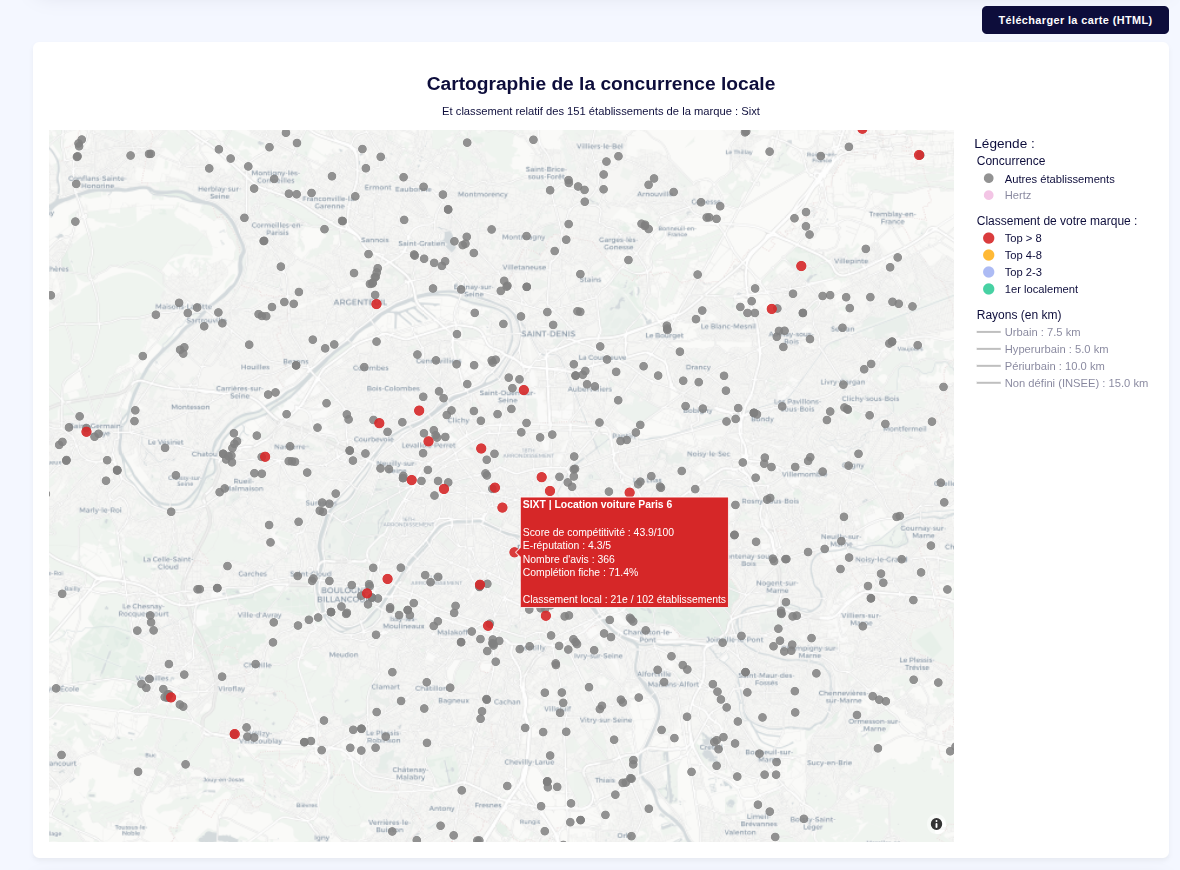
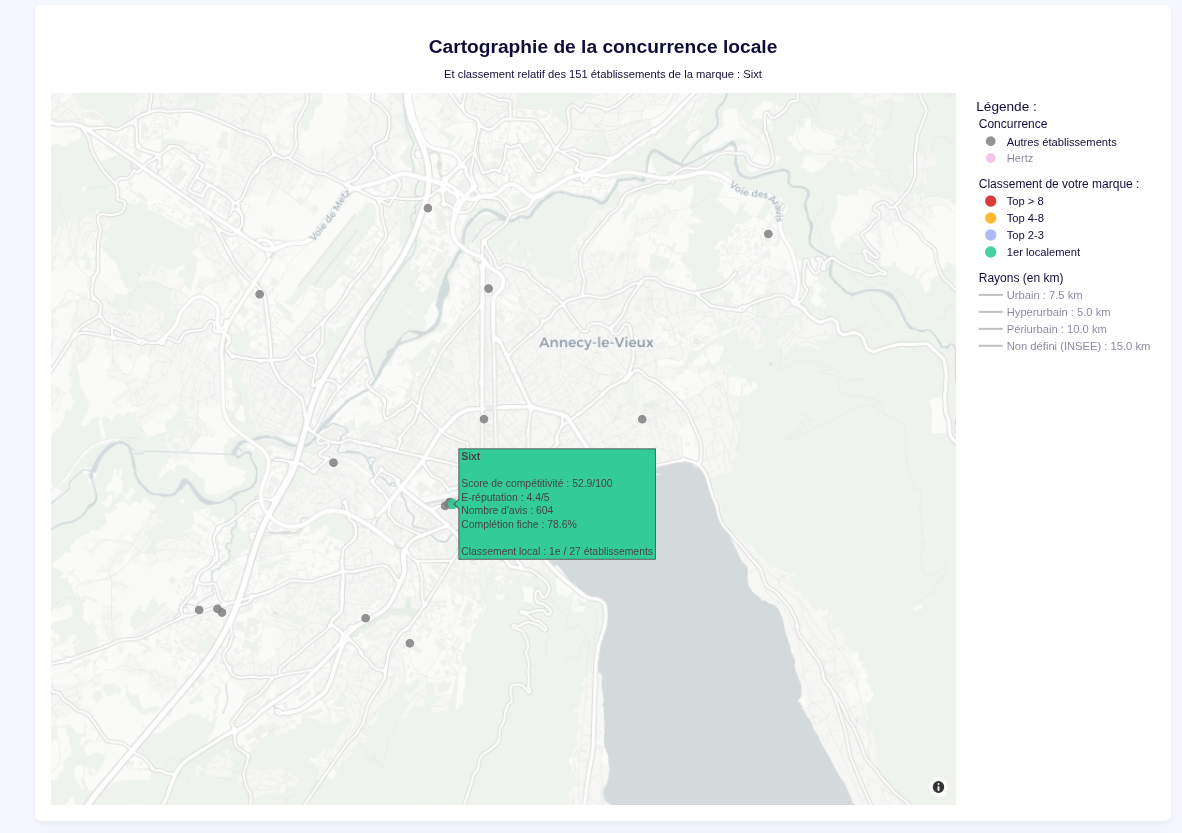
5. Local Brand vs. Competitors Clustering
This module maps the brand's true competitiveness on a hyper-local scale.
- It locates every shop belonging to the target brand.
- It draws a specified geographic radius around each location.
- It uses Haversine distance calculations to identify all direct local competitors strictly within that perimeter.
- It compares each metrics of each shop with it's competitor and defines a dynamic ranking.
- Optional : the user can declare the customer's nemesis brandnames to display them directly on the map too.
- The map can be exported in HTML with the filtering / zoom options still working.
Technical Challenges & Engineering Solutions
1. Memory Management on Constrained Infrastructure
The initial prototype was deployed on a highly constrained Render instance (512 MB RAM). To maintain detail without OOM
errors, I implemented:
- Dataset Chunking: Optimized the ETL process to handle incoming data in smaller chunks.
- Client-Side Rendering Delegation: The server now strictly serializes the data into pure Python lists, offloading
the Plotly rendering workload to the user's browser.
2. Mathematical Modeling & Geospatial Clustering
- Statistical Modeling: Pivoted to a model based on descriptive statistics and multidimensional analysis
for a fluid, data-driven comparison. - Geospatial Trigonometry: Implemented the Haversine formula to calculate Great-circle distances on the Earth's
surface. - Infrastructural Data Integration: Integrated open-source INSEE "Bassin de vie" (Living Zones) datasets to
ensure clusters respect official socio-economic boundaries. Can't thank them enough for that !
Project Outcome
This was my true first production project, it took about 1 week of research, 2 weeks to develop and test.
Following heavy testing, the deployment on a dedicated instance has been seamless. The success with the Sales team
was so significant that it convinced both the Marketing and Customer Care departments to integrate the tool into their
own workflows.
After about a 1 month in production, more than 158 uniques brands and 263 000 shops have been scrapped and analyzed.